We have developed new powerful methods of analyzing potential shading issues with any solar installation. Using Google Maps and Blender, we create a 3D animation showing how the sun will illuminate your home/business over the entire year, modeling one day’s sunshine for every month of the year. This quickly identifies trees that may impact total power output for example.
In many cases these impacts are much smaller than they may appear, as they tend to appear more during winter months when the sun is low to the horizon, and value is less in winter.
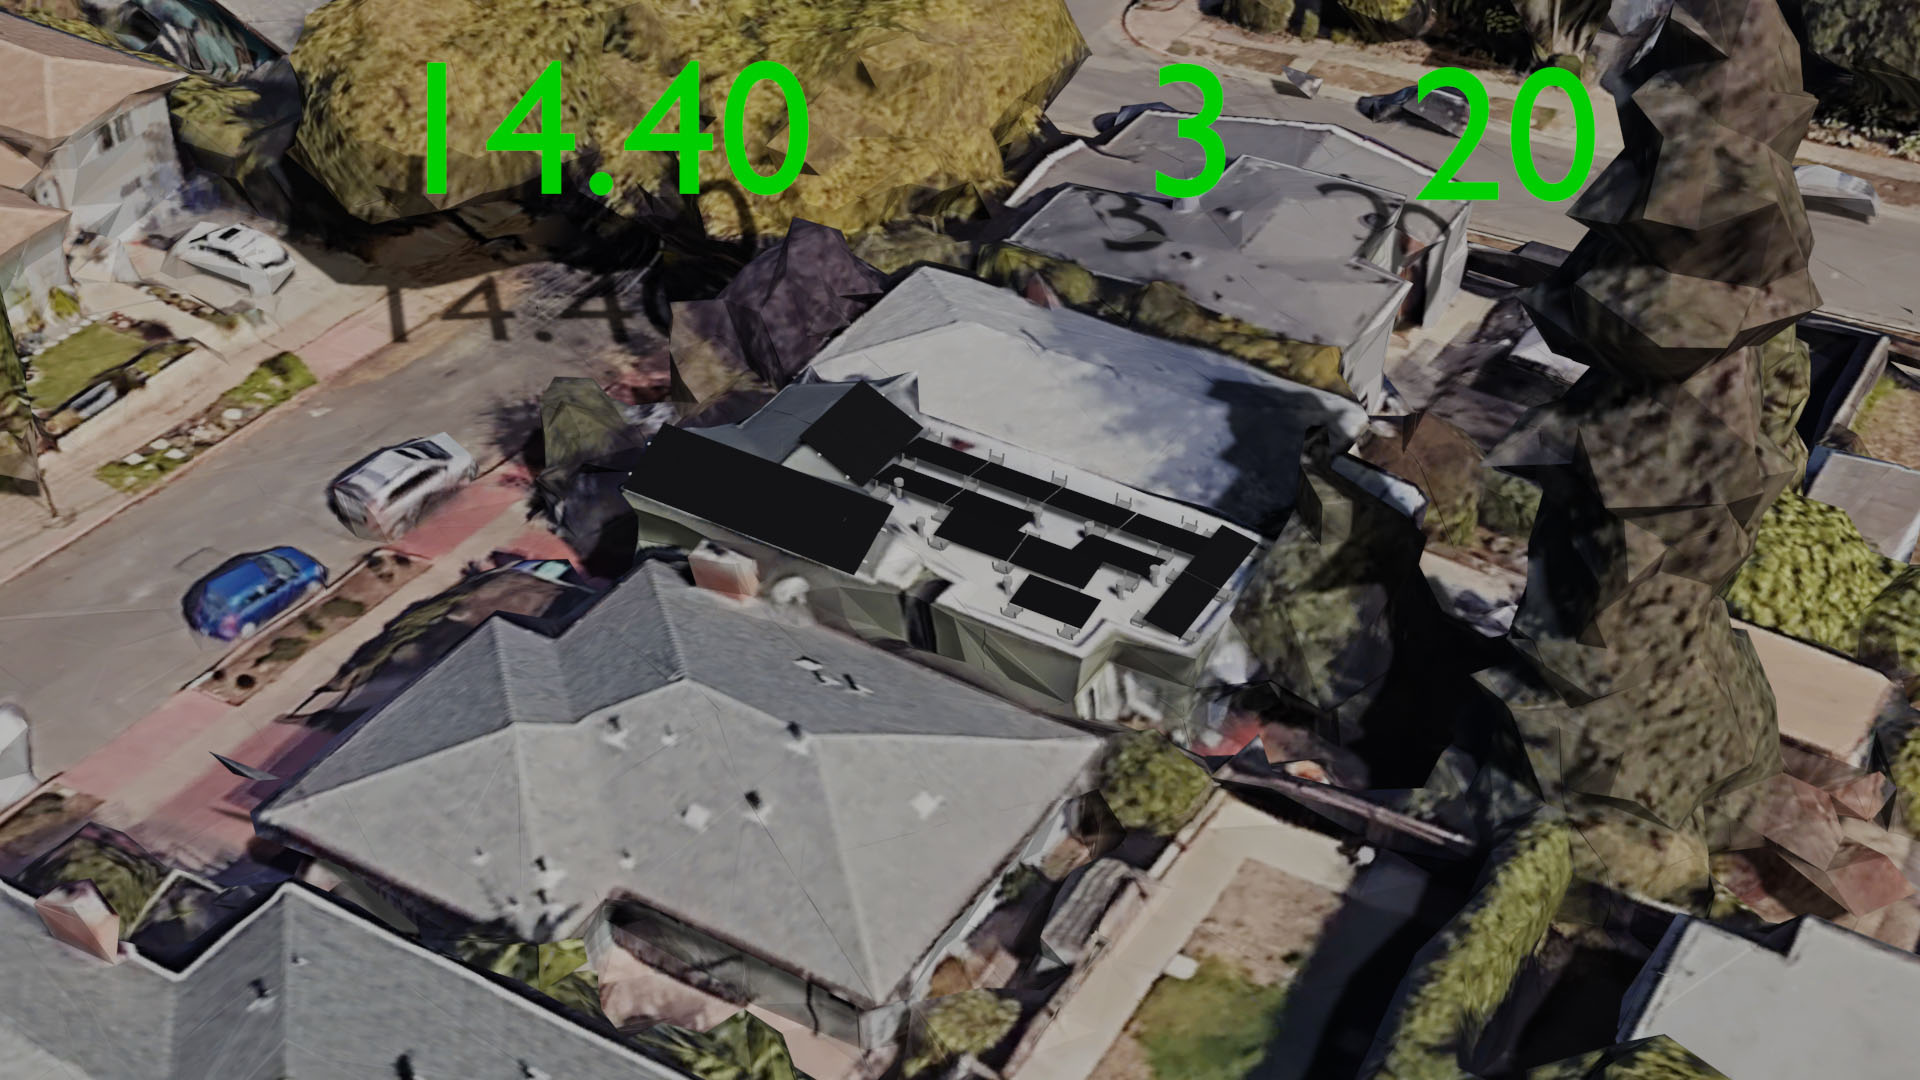
See example animation here